| Linear Search Algorithm
in Gene Name Batch Viewer |
||||||||||||||||||||||||||||||||||||||||||||||||||||||
Gene
Name Batch Viewer
|
||||||||||||||||||||||||||||||||||||||||||||||||||||||
|
|
||||||||||||||||||||||||||||||||||||||||||||||||||||||
The Related Gene Searching Algorithm |
||||||||||||||||||||||||||||||||||||||||||||||||||||||
| 1. Introduction |
||||||||||||||||||||||||||||||||||||||||||||||||||||||
|
Any given gene is
associating with a set of annotation terms. If genes share similar set
of those terms, they are most likely involved in similar biological
mechanisms. The algorithm adopts kappa statistics to quantitatively
measure the degree of the agreement how genes share the similar
annotation terms. Kappa result ranges from 0 to 1. The higher the value
of Kappa, the stronger the agreement. Kappa more than 0.7 typically
indicates that agreement of two genes are strong. Kappa values greater
than 0.9 are considered excellent. |
||||||||||||||||||||||||||||||||||||||||||||||||||||||
| 2. A Hypothetical Example | ||||||||||||||||||||||||||||||||||||||||||||||||||||||
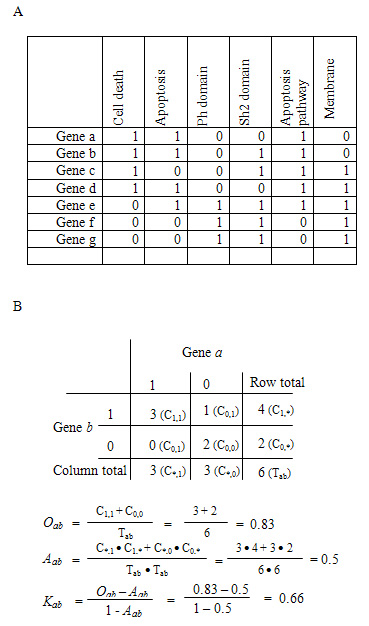 Figure: A hypothetical example to detect gene-gene functional relationship by kappa statistics. A. The all-redundant and structured terms are broken into ‘independent’ terms in a flat linear collection. Each gene associates with some of the annotation term collection so that a gene-annotation matrix can be built in a binary format, where 1 represents a positive match for the particular gene-term and 0 represents the unknown. Thus, each gene has a unique profile of annotation terms represented by a combination of 1s and 0s. B. For a particular example of genes a and b, a contingency table was constructed for kappa statistics calculation. The higher kappa score (0.66) indicates that genes a and b are in considerable agreement, more so than by random chance. To flip the table 90 degrees, the kappa score of term-term can be achieved, based on the agreement of common genes (not shown).
|
||||||||||||||||||||||||||||||||||||||||||||||||||||||
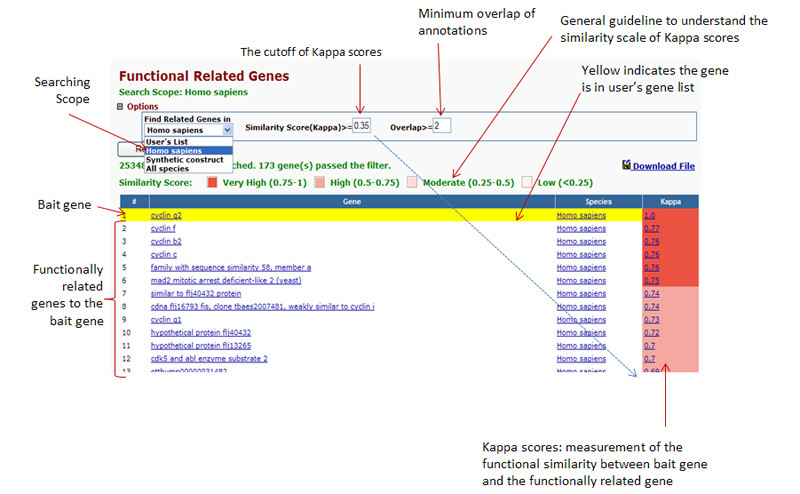
| 3. Options and Results | ||||||||||||||||||||||||||||||||||||||||||||||||||||||
|
Overlap Threshold Option:
The
minimum Kappa value for the consideration. The higer of threshold, the
stricter of the search. Default is 0.25 and setting range from 0 to 1. Related Gene Column:
|
||||||||||||||||||||||||||||||||||||||||||||||||||||||
| 4. Kappa Statistics | ||||||||||||||||||||||||||||||||||||||||||||||||||||||
| The Kappa Statistic is a chance corrected measure of agreement between two sets of categorized data. Kappa result ranges from 0 to 1. The higher the value of Kappa, the stronger the agreement. If Kappa = 1, then there is perfect agreement. If Kappa = 0, then there is no agreement. For further details about Kappa statistics please refer to "A coefficient for agreement of nominal scales" Educational and Psychological Measurement 20: p 37-46. | ||||||||||||||||||||||||||||||||||||||||||||||||||||||
| top |
||||||||||||||||||||||||||||||||||||||||||||||||||||||
| The Related Term Searching Algorithm | ||||||||||||||||||||||||||||||||||||||||||||||||||||||
|
1.
Introduction |
||||||||||||||||||||||||||||||||||||||||||||||||||||||
|
Typically, a biological process/term is a cooperationof a set of genes. If two or more biological processes are done by similar set of genes, the processes might be related in the biological network somehow. To identify the related biological processes/terms can help biologists to assemble a bigger biological picture for better understanding biological themes. This algorithm adopts kappa statistics to quantitatively measure the degree of the agreement how terms share the similar participating genes for. After scanning all pairs of given term to other terms, the closely related terms to the given one could be listed and sorted. Kappa result ranges from 0 to 1. The higher the value of Kappa, the stronger the agreement. Kappa more than 0.7 typically indicates that agreement of two genes are strong. Kappa values greater than 0.9 are considered excellent |
||||||||||||||||||||||||||||||||||||||||||||||||||||||
| 2. A Hypothetical Example | ||||||||||||||||||||||||||||||||||||||||||||||||||||||
|
After reducing
participating gene information to its most basic level using a binary
mode (1 represents ‘Yes’ and 0 is ‘No’), term A and B share the same
participating genes 1, 3, and n, in contrast that term A and C only
share gene 3. Obviously, the relationship of term A-B is stronger than
that of term A- C.
2x2 contigency tables for both, based on above raw data:
Kappa for Term A-B = 1; Kappa for Term A-C = 0.2; Therefore, the relationship of A-B is much stronger than that of A-C. |
||||||||||||||||||||||||||||||||||||||||||||||||||||||
| 3. Options and Results | ||||||||||||||||||||||||||||||||||||||||||||||||||||||
|
Overlap Threshold Option:
The minimum Kappa value
for the consideration. The higer of threshold, the stricter of the
search. Default is 0.25 and setting range is from 0 to 1.
|
||||||||||||||||||||||||||||||||||||||||||||||||||||||
| 4. Kappa Statistics | ||||||||||||||||||||||||||||||||||||||||||||||||||||||
|
The Kappa Statistic is a chance corrected measure of agreement between two sets of categorized data. Kappa result ranges from 0 to 1. The higher the value of Kappa, the stronger the agreement. If Kappa = 1, then there is perfect agreement. If Kappa = 0, then there is no agreement. For further details about Kappa statistics please refer to "A coefficient for agreement of nominal scales" Educational and Psychological Measurement 20: p 37-46. |
||||||||||||||||||||||||||||||||||||||||||||||||||||||
| top |
||||||||||||||||||||||||||||||||||||||||||||||||||||||
|
Last Updated: Feb.
2005
|
||||||||||||||||||||||||||||||||||||||||||||||||||||||